


Graafilise kasutajaliidesega rakendus Audytor CH on mõeldud uute küttesüsteemide loomiseks, olemasolevate süsteemide kohandamiseks (nt soojustatud hoonetes) ning jahutussüsteemide projekteerimiseks (jääveetorustikud). Oluline funktsioon on võimalus kasutada ühes projektis mitut kütteallikat või jahutusainet, mis kasutada, näiteks, neljatorulist süsteemi.
The results are in Estonian language in the C.H. 3.8 version.


New features in SET 7.4
In the newest version of program Audytor SET new functions and several enhancements have been implemented to speed up the installation design process.
Main changes:
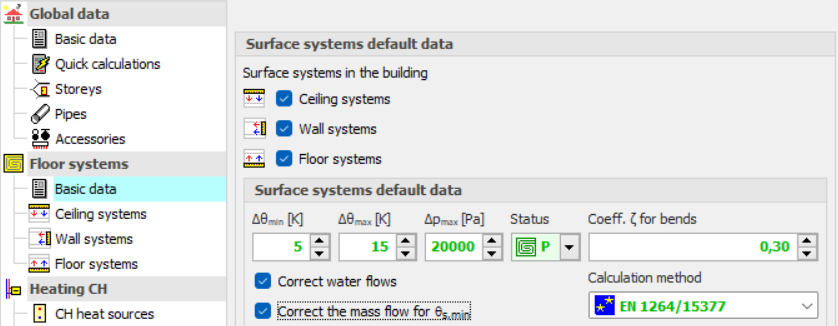
- Surface systems - a ceiling system and a wall system
- Calculations of resulting cooling efficiency of the installation
| READ MORE |
Surface systems
The Audytor SET 7.4 program introduced the possibility of designing surface systems - a ceiling system and a wall system. Among the surface systems, we also will find the well-known floor system
Before starting the design of the surface system, the user should declare the parameters related to the radiator's constrution. The constrution data will be automatically inherited directly into the drawning, significantly reducing the data entry time.
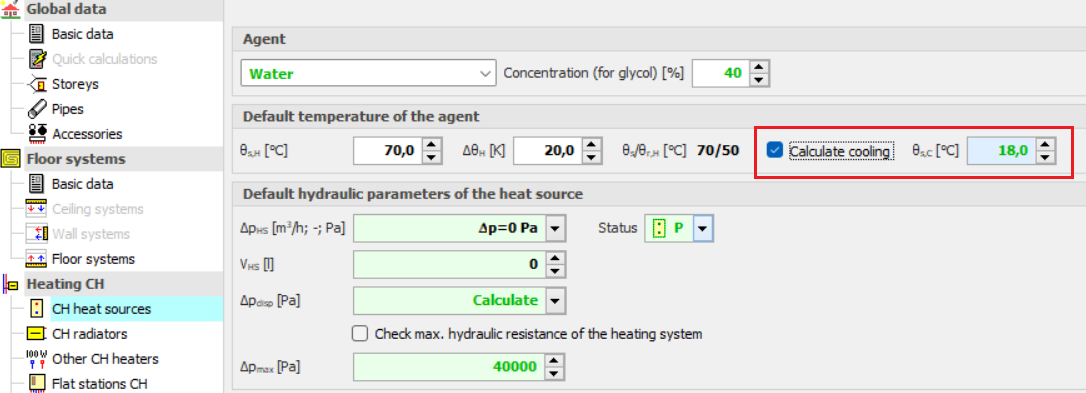
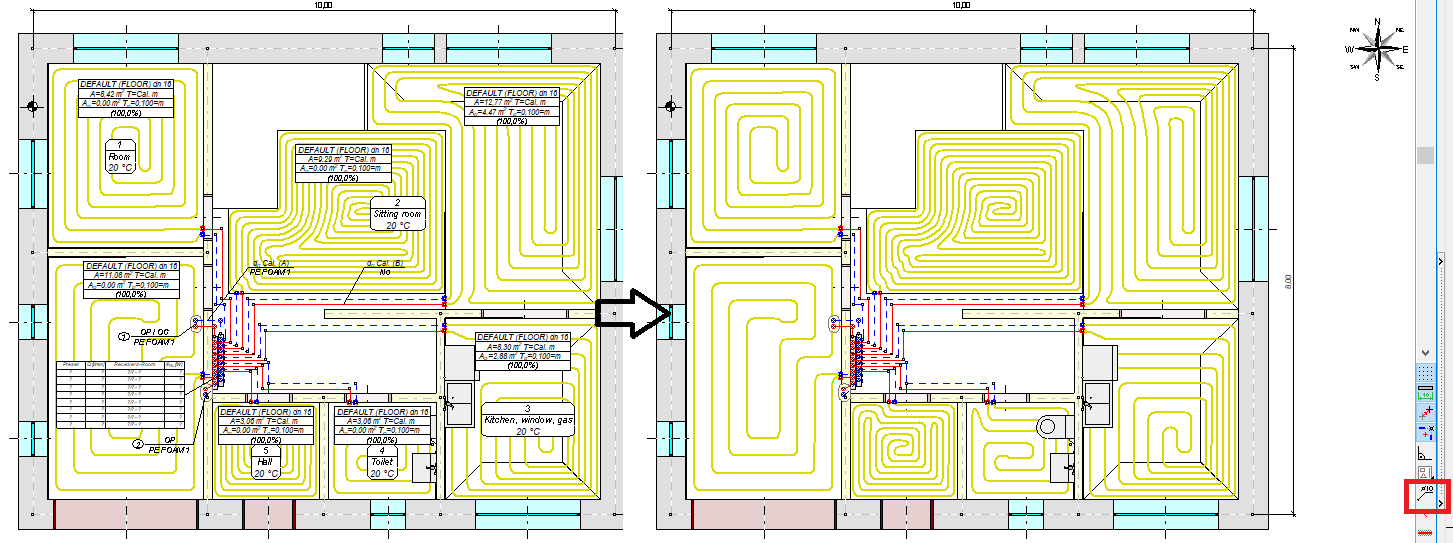
Calculations of the resulting cooling efficiency of the installation
After designing the surface installation with heating parameters, the program will determine the resulting cooling power when switched to cooling mode.
These calculations will be performed if the CC module is activated in the general data and if in CH Heat Sorce Tab the Calculate Cooling option is enabled
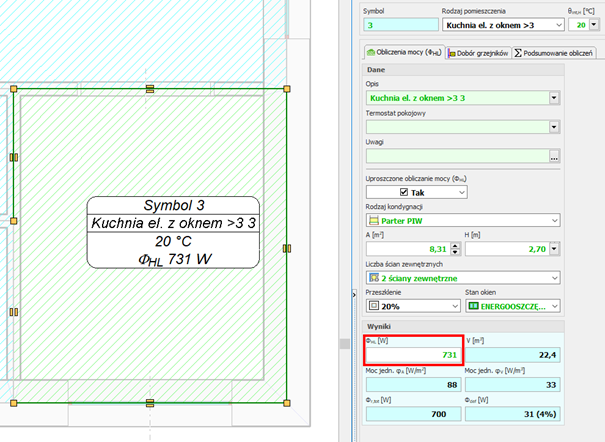
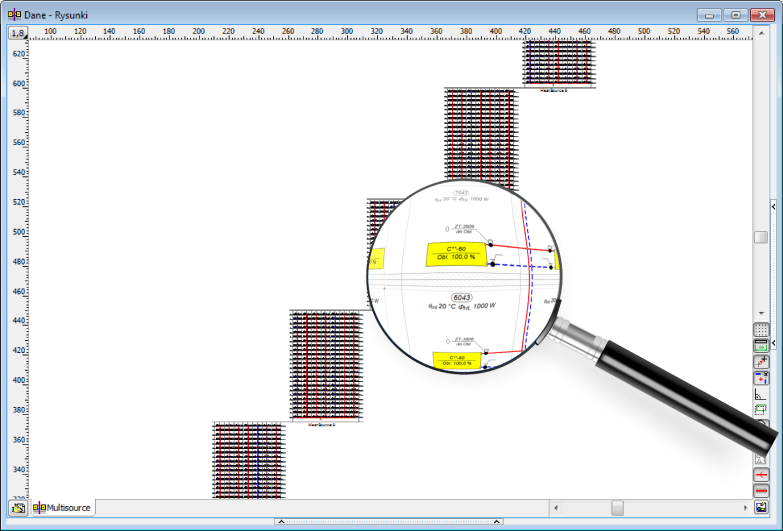
The program uses the same flow rate of the agent in cooling mode as in the heating system. After performing the calculations, the results can be read both on the drawing – for example, on a tabular label attached to the manifold – and from the general tabular results.

Calculations of the resulting cooling efficiency of the installation
After designing the surface installation with heating parameters, the program will determine the resulting cooling power when switched to cooling mode.
These calculations will be performed if the CC module is activated in the general data and if in CH Heat Sorce Tab the Calculate Cooling option is enabled.
The program uses the same flow rate of the agent in cooling mode as in the heating system. After performing the calculations, the results can be read both on the drawing – for example, on a tabular label attached to the manifold – and from the general tabular results.
Audytor SET 7.3 - new possibilities!
The latest version of Auditor SET introduced new features and a number of improvements to speed up the installation design process.
The main changes are:
- New concept of work with SET program.
- New Fast Calculation (FC) module, which allows you to perform fast, approximate calculations of the thermal load of rooms and preliminary calculations of installations.
- Improvements in the design process of surface installations.
- Changed layout of the bill of materials.
- Changed module for viewing catalog data and selecting devices from catalogs.
- Improvements related to drawing wires.
- Improvements in graphics.
| HOW TO SWITCH TO 7.3 VERSION | GET MORE INFORMATION |
New concept of work with SET program
The new Fast Calculation (FC) module in the SET Auditor provides the opportunity for simplified installation design. It also makes it possible to speed up the creation of professional designs
In professional design mode, elements of simplified design can be used to streamline the design process (fast estimation of heat loss in the absence of results from the OZC program, selection of space heating concepts, etc.).
Both the simplified design and the detailed professional design are saved in the same file, which facilitates further work with the project.
Fast calculations of room thermal load
This function enables calculation of the value of room thermal load in a simplified manner based on a few basic parameters.
Thanks to this function, the designer can select the appropriate method of heating the room and get an idea of the type of heating equipment to be used in the room.
The surface layout suggested by the program can be inserted into the floor plan drawing.

Fast selection of elements without the need to draw the entire installation
When performing fast calculations, the program selects radiator power and duct diameters even if the heat source is not entered. From the default values declared in the general data, it inherits the parameters separately for the installation with radiators, separately for underfloor heating and places a virtual source in the resulting drawing.

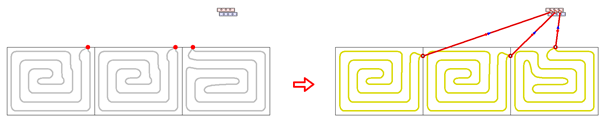
Automatic generation of simplified connection routes
After selecting the manifold and individual receivers, the program generates simplified connections automatically.
Function of quick calculation of underfloor radiators
This function makes it possible to perform calculations for a group of underfloor radiators during the design process, before the complete calculation of the installation. Thanks to this, it is possible to quickly test the response of the calculation results to individual data (e.g. supply temperature, heating floor structure, diameter of the pipes, spacing of pipes, division into several circuits, etc.).
The function of quick selection of underfloor radiators allows to determine:
- possible supply temperature range for individual radiators
- maximum supply temperature for the indicated group of radiators
- proposed division of coils in order to meet the criteria of maximum hydraulic resistance and maximum length
- proposed division of coils in order to reduce the differences in resistance between coils and to facilitate hydraulic balancing of the installation.


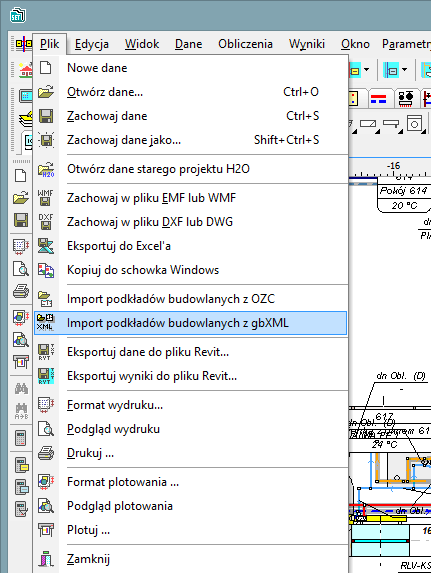
Import of building bases in PDF format
The Audytor program has long been able to import drawings in many popular formats. DWG and DXF formats are particularly suitable for technical drawings. However, in market practice, a large part of the documentation is provided in PDF files. Although it is a general format and not addressed to technical drawings, due to frequent use, the Audytor SET software has the option of importing drawings also in this format.
Drawing of underfloor heating coils
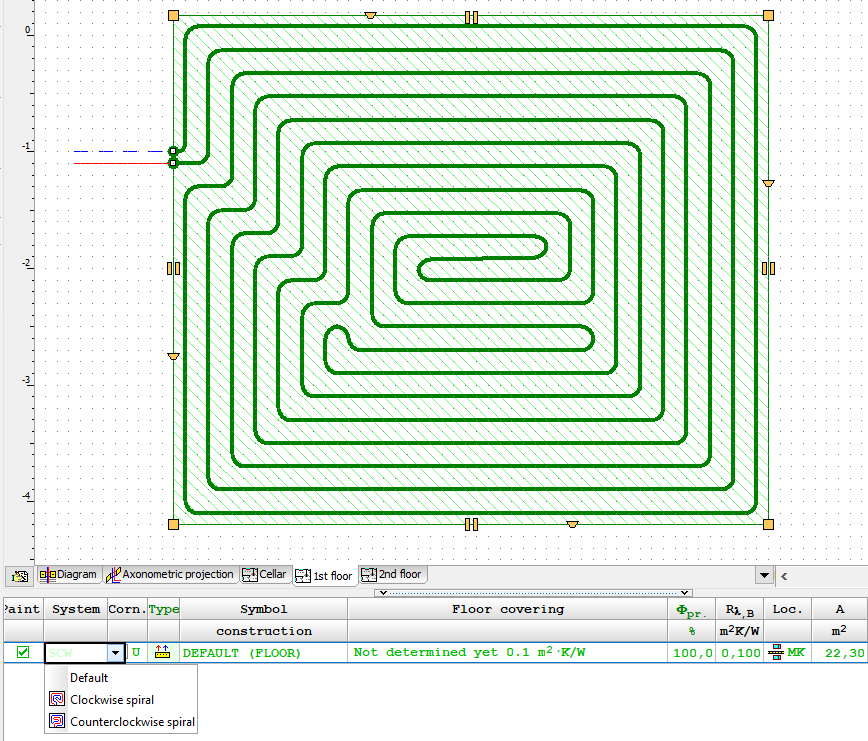
The program has expanded the possibilities of automatic drawing of floor heating coils. Currently, the user can choose one of the following ways to create a given coil:
- spiral with clockwise direction
- spiral with counter-clockwise direction
- meander coil.
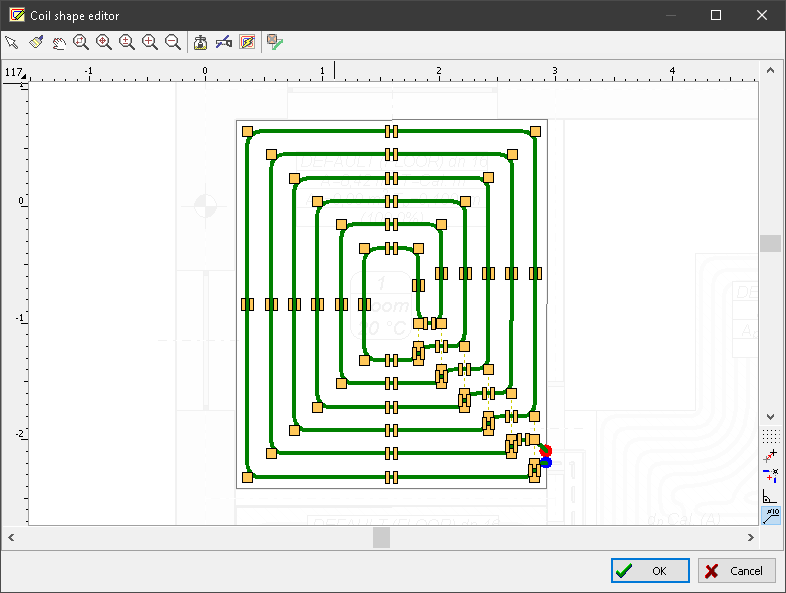
Besides, the user can edit (correct) the coil shape created by the program.
New graphic design of the Audytor SET program
The graphic design has been changed in the program - both in terms of the graphic style and window organization. Thanks to this, they have become even more transparent

Mechanism for determining the effective heating surface of floor heaters
The automatic coil pipe generation mechanism has been extended with a function that allows determining the effective heating surface of a floor heater. The coil system can occupy the surface of the entire heater or "bypass" the manifold and connecting pipes of other heaters. It is also possible to designate zones to turn off part of the heating zone without having to change the shape of the heater itself.

Dividing and joining heating zones, rooms and polygons
Tools for quickly dividing and connecting polygons that define hotplates. One field can be divided into two or three equal fields - horizontally or vertically, respectively. The user can also indicate a dividing line using a broken line. At the same time, the option of combining several cooking zones into one has been introduced.
These functions are especially useful when designing underfloor heating, but can be used for sharing
and joining other polygons (e.g. room zones).

Selection of coil drawing direction
The program allows you to choose the direction of drawing the spiral coil clockwise or counterclockwise.
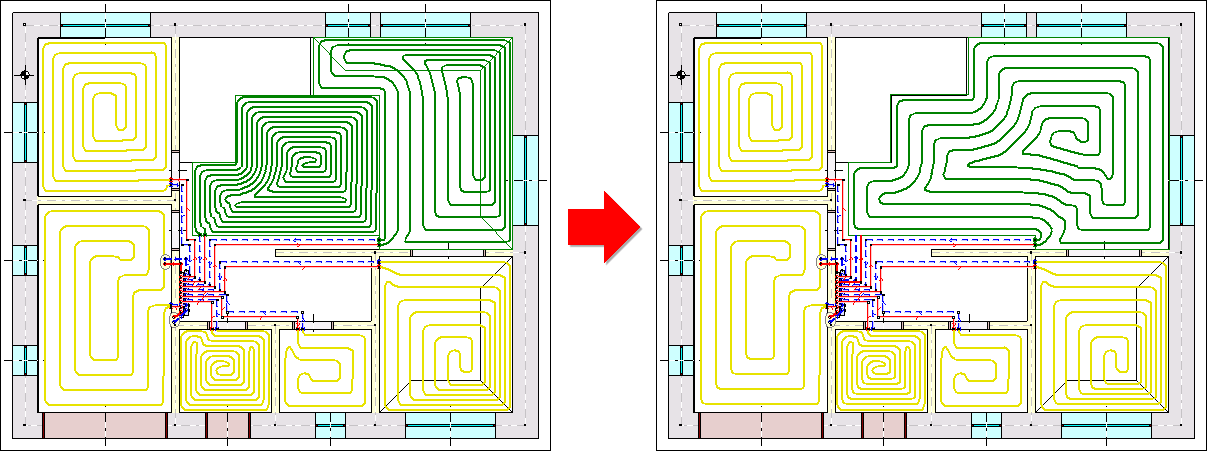
Choice of pipe laying method in concave corners
Depending on the shape of the room and the assumed coil pipe laying system, it is possible to impose a way of drawing pipes "bypassing" concave corners.

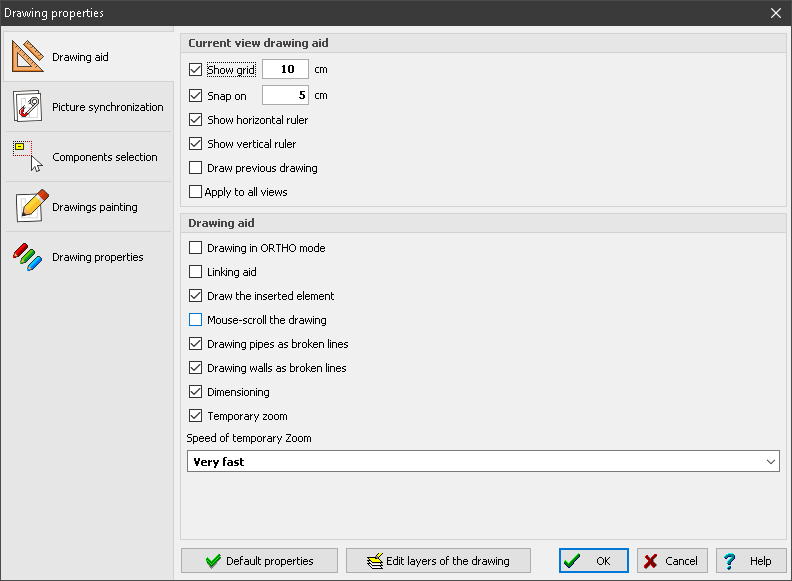
Auxiliary lines for manual drawing of the coil
If the automatic coil generated option is switched off, the program displays auxiliary lines supporting manual drawing of lines. The lines are drawn with a given spacing taking into account the spacing in the peripheral zone.

Insert a heating zone around the cursor
The function of automatic insertion of a heating zone in the room zone (so-called insertion around the cursor).
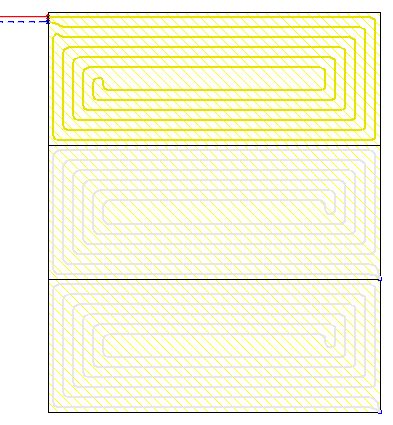
Showing unconnected heating zones
The heating zones before connecting to the pipes are displayed in less intense colors, thanks to which it is very easy to know which fields still need to be connected.
Extending the range of mixing group schemes
Extended range of mixing group schemes with the possibility of local mixing at the manifold.
Drawing in drawing
It is possible to insert a fragment of another drawing in the drawing. This significantly increases the possibility of creating clear technical documentation.
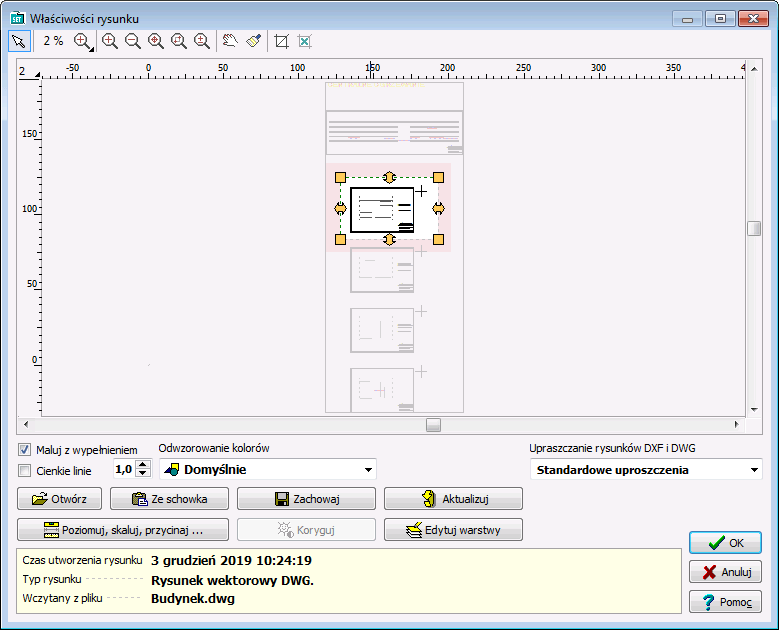
Inserting a fragment of a DWG drawing
The ability to easily use one DWG file containing architectural plans of many floors.
The user can indicate which parts of the DWG file are to be used on each floor and then adjust their position using precision panning tools.
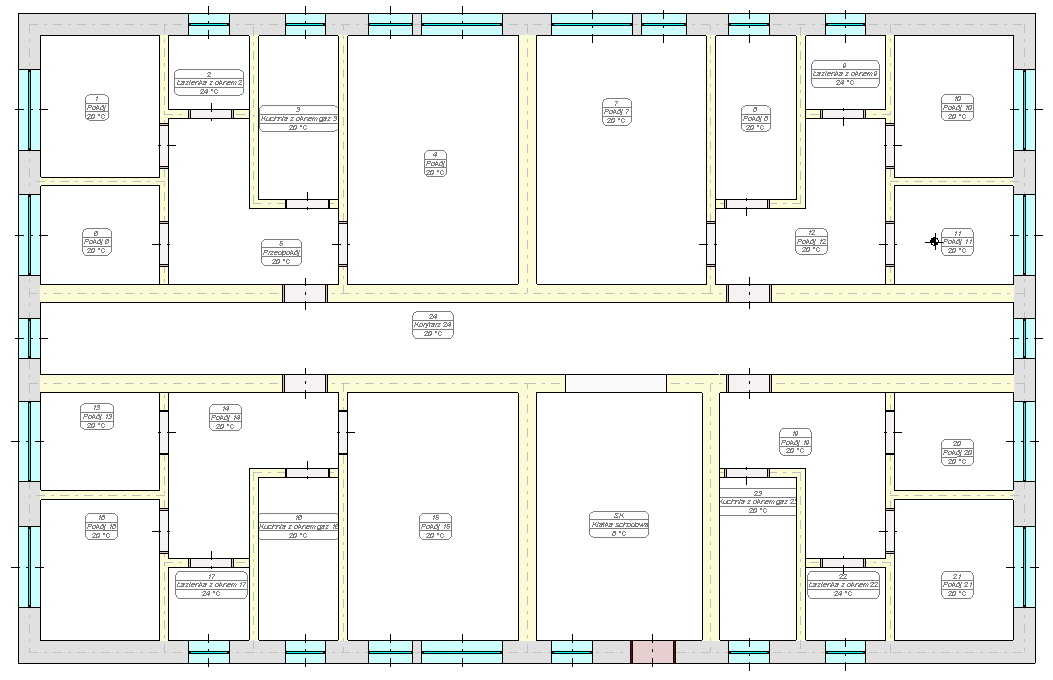
Coloring the walls
Display of walls with filling - gray for external walls and yellow for internal walls. This improves the readability of created drawings.
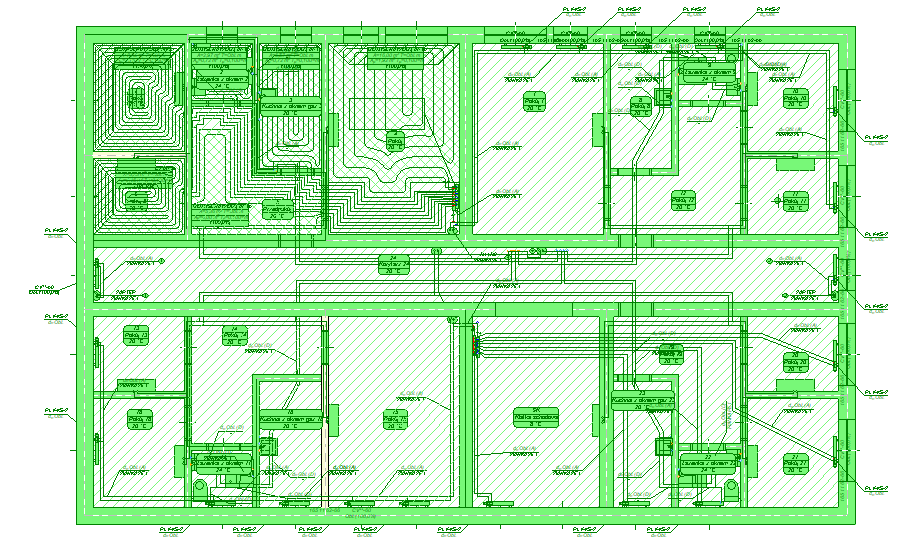
Selection in color
When selecting objects using the window, the selection window is filled with blue, which improves its readability.
Readability of selected objects has also been increased by displaying them with all details in green.
Selective selection
The selective selection function allows you to indicate what elements of the drawings are to be marked (e.g. rooms, pipes, fittings, etc.).
This function is useful when, for example, the user would like to duplicate selected elements from the indicated area to the next floor.

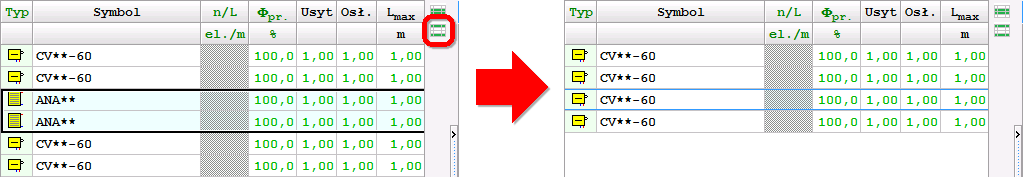
Narrow the range of selected objects in the tables
The functions Leave selected lines and Leave unselected lines allow you to narrow the range of selected objects. After selecting a number of elements in the drawing window, you can then remove from the selection the items indicated in the table or just leave those items.

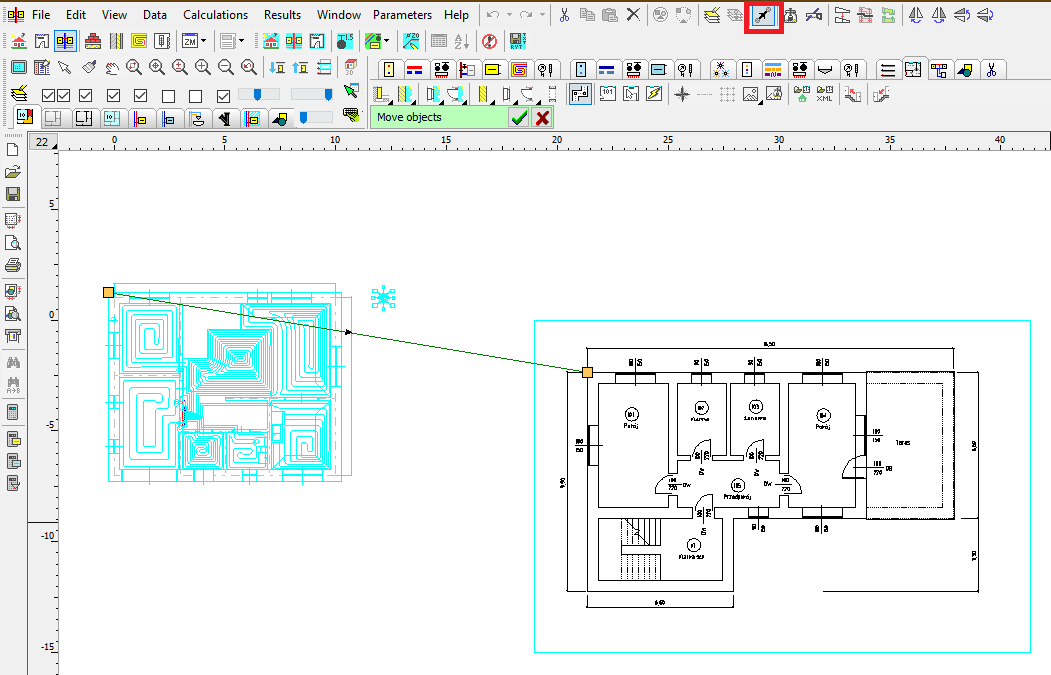
Precise moving of objects
This function enables precise moving of objects. The user defines the displacement vector, i.e. specifies the start and end points.
This function, combined with the Magnifier tool, enables very precise moving of objects. It is very useful, in the case of matching architectural objects on different floors. Just enable the display of the previous floor and then indicate the corresponding points on the architectural plans of two floors.
Improved critical flow display
When you turn on critical flow display, the other elements of the drawings are displayed less intensively. This makes it even easier to orient yourself in the course of critical circulation.

Drawing adjacent floors
Expanding the possibilities of displaying (drawing) the previous floor.
Currently, elements of the previous storey or the next storey can be displayed, or both. This facilitates adjusting architectural projection positions and location of installation risers.

Temporarily turn off of the label display
The option of temporarily turning off the display of labels during design, improves the readability of drawings on the screen in situations where labels are not necessary.
Adjusting wall thickness
This option allows you to change the thickness of the walls when drawing them:
– CTRL + left square bracket - reducing the wall thickness,
– CTRL + right square bracket - increasing wall thickness.
The same effect can be achieved by pressing the CTRL key while holding the mouse wheel. This function allows easy adjustment of the wall thickness to the loaded building foundation (planview).

Export extension to Excel
The ability to export to Microsoft Excel not only individual tables, but also all tables and diagnostics at once. This significantly reduces exporting time if you need to save a number of tables.
Import and export of drawings in DWG format
The program has been equipped with the latest cooperation module with DWG and DXF files.
It allows among others:
- Loading DXF and DWG drawings in the newest versions.
- UNICODE text support for most characters to be displayed correctly.
- Export of drawings in the following formats: DWG, DXF, PDF, SVG, CGM, HPHL, SWF.
- Significantly faster display of complex drawings thanks to the simplified paint function.
- A more realistic export of drawings to DXF and DWG files.
- Saving raster drawings in DXF and DWG files.
- More convenient management of drawing layers


Import of building bases from Autodesk® Revit®
The function allows to create layout of corresponding to the levels on which rooms have been defined in Autodesk® Revit®. The transfer of data takes place via a file generated in Autodesk® Revit® using the Audytor gbXML plugin.
Export of the installation project to Autodesk® Revit®
The function allows you to export the installation project to a file that can later be loaded into Autodesk® Revit® using the Audytor SET plugin for Revit.
The function allows you to export from the data and export from the results. Export from data allows you to save even an incomplete installation project (not recalculating), for example, the arrangement of the water risers, or the layout of the radiators. Export from results allows us to use technical data of selected pipes and devices in Autodesk® Revit®, eg pipe diameters, valve settings, radiator sizes, and pipe spacing in underfloor heating. In addition, physical quantities are available, such as the medium speed, the power of the radiator, and pressure losses.

| 7.2 Pro | 7.2 Basic | 7.1 Pro | 7.1 Basic | 6.0 Pro | 6.0 Basic | 4.1 | 4.0 | 365 Pro | 365 Basic | |
|---|---|---|---|---|---|---|---|---|---|---|
| Calculations of the resulting cooling efficiency of the installation |

|
|
||||||||
| Calculations of the resulting cooling efficiency of the installation |
|
|
||||||||
| New concept of work with SET program |
|
|
||||||||
| Fast calculations of room thermal load |
|
|
||||||||
| Fast selection of elements without the need to draw the entire installation |
|
|
||||||||
| Automatic generation of simplified connection routes |
|
|
||||||||
| Function of quick calculation of underfloor radiators |
|
|
|
|
||||||
| Import of building bases in PDF format |
|
|
|
|
||||||
| Drawing of underfloor heating coils |
|
|
|
|
||||||
| New graphic design of the Audytor SET program |
|
|
|
|
||||||
| Mechanism for determining the effective heating surface of floor heaters |
|
|
|
|
||||||
| Dividing and joining heating zones, rooms and polygons |
|
|
|
|
||||||
| Selection of coil drawing direction |
|
|
|
|
||||||
| Choice of pipe laying method in concave corners |
|
|
|
|
||||||
| Auxiliary lines for manual drawing of the coil |
|
|
|
|
||||||
| Insert a heating zone around the cursor |
|
|
|
|
||||||
| Showing unconnected heating zones |
|
|
|
|
||||||
| Extending the range of mixing group schemes |
|
|
|
|
||||||
| Drawing in drawing |
|
|
|
|
||||||
| Inserting a fragment of a DWG drawing |
|
|
|
|
||||||
| Coloring the walls |
|
|
|
|
||||||
| Selection in color |
|
|
|
|
||||||
| Selective selection |
|
|
|
|
||||||
| Narrow the range of selected objects in the tables |
|
|
|
|
||||||
| Precise moving of objects |
|
|
|
|
||||||
| Improved critical flow display |
|
|
|
|
||||||
| Drawing adjacent floors |
|
|
|
|
||||||
| Temporarily turn off of the label display |
|
|
|
|
||||||
| Adjusting wall thickness |
|
|
|
|
||||||
| Export extension to Excel |
|
|
|
|
||||||
| Display of system pipes with actual diameters |
|
|
|
|
|
|
||||
| Intelligent duplication of system components - "down". |
|
|
|
|
|
|
||||
| A system of editable keyboard shortcuts |
|
|
|
|
|
|
||||
| The function of organizing labels on several floors at the same time |
|
|
|
|
|
|
||||
| Import and export of drawings in DWG format |
|
|
|
|
|
|
||||
| Import of building bases from Autodesk® Revit® |
|
|
|
|
||||||
| Export of the installation project to Autodesk® Revit® |
|
|
|
|
||||||
| The ability to check the correctness of the floors layout |
|
|
|
|
|
|
|
|
||
| Creating a list of fittings |
|
|
|
|
|
|
|
|
|
|
| Adjustment of existing installations |
|
|
|
|
|
|
|
|
|
|
| Designing new installations |
|
|
|
|
|
|
|
|
|
|
| Designing a traditional two-pipe installation |
|
|
|
|
|
|
|
|
|
|
| Desiging on plan views |
|
|
|
|
|
|
|
|
|
|
| Desiging on diagrams |
|
|
|
|
|
|
|
|
|
|
| Loading of building bases with the results of heat load from the Audytor HL program |
|
|
|
|
|
|
|
|
|
|
| Loading the list of rooms with the results of the heat load from the Audytor HL software |
|
|
|
|
|
|
|
|
|
|
| The ability to draw building bases (walls, windows and doors) |
|
|
|
|
|
|
|
|
|
|
| Automatic creation of diagrams of risers based on plan views |
|
|
|
|
|
|
|
|
|
|
| Visualization of critical circuits |
|
|
|
|
|
|
|
|
|
|
| Auxiliary lines indicating characteristic points |
|
|
|
|
|
|
|
|
|
|
| Drawing lines in pairs (supply - return) |
|
|
|
|
|
|
|
|
|
|
| Drawing lines with a continuous broken line |
|
|
|
|
|
|
|
|
|
|
| Automatic inserting of radiators under the windows |
|
|
|
|
|
|
|
|
|
|
| Automatic connection of radiators to distribution pipes |
|
|
|
|
|
|
|
|
|
|
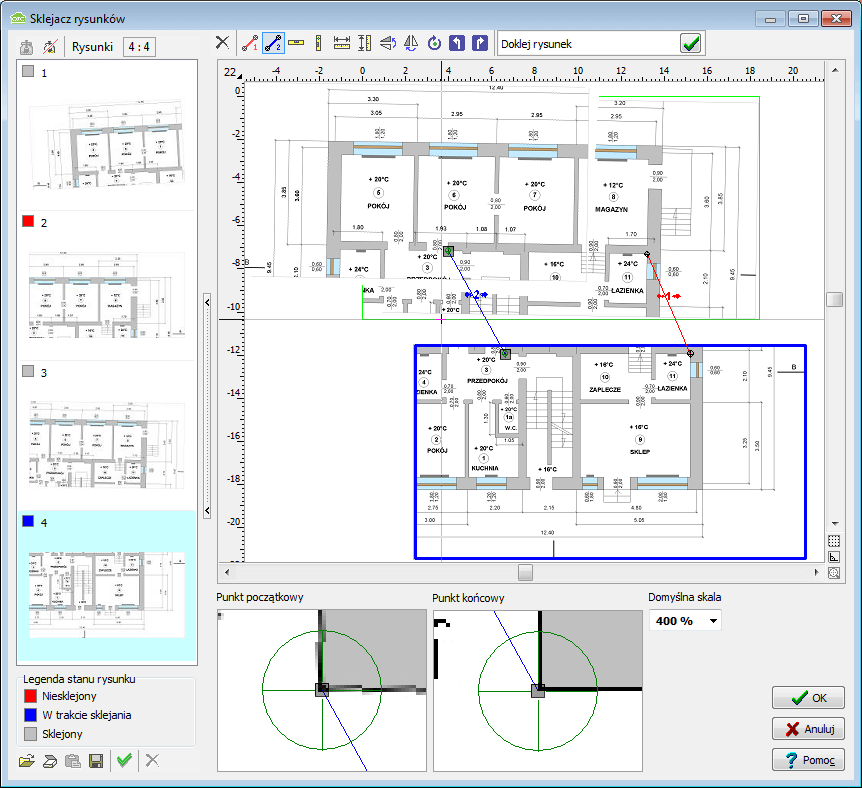
| Bonding and scaling drawings |
|
|
|
|
|
|
|
|
|
|
| Graafiline redaktor |
|
|
|
|
|
|
|
|
|
|
| Duplicating fragments of drawings within a storey and to the next storeys |
|
|
|
|
|
|
|
|
|
|
| Vaikeandmete rakendamise süsteem |
|
|
|
|
|
|
|
|
|
|
| Creating mirror images of parts of drawings |
|
|
|
|
|
|
|
|
|
|
| Working in a shared environment Audytor SET |
|
|
|
|
|
|
||||
| Ready-made blocks of typical parts of the installation |
|
|
|
|
|
|
|
|
|
|
| Backup system of data files |
|
|
|
|
|
|
||||
| Ability to create your own blocks |
|
|
|
|
|
|
|
|
|
|
| Extensive directory database |
|
|
|
|
|
|
|
|
|
|
| Extended editing functions in tables |
|
|
|
|
|
|
|
|
|
|
| "Find and Replace" function in tables |
|
|
|
|
|
|
|
|
|
|
| Põranaküttesüsteemide projekteerimine |
|
|
|
|
|
|
|
|
|
|
| Automatic drawing of the underfloor heating coil |
|
|
|
|
|
|
|
|
||
| Andmete kontroll ja arvutustulemused |
|
|
|
|
|
|
|
|
|
|
| Three-dimensional visualization of the installation |
|
|
|
|
|
|
|
|
||
| Extended error diagnostics |
|
|
|
|
|
|
|
|
|
|
| Automatic axonometry of the installation |
|
|
|
|
|
|
||||
| Defining default data for all kinds of devices |
|
|
|
|
|
|
|
|
|
|
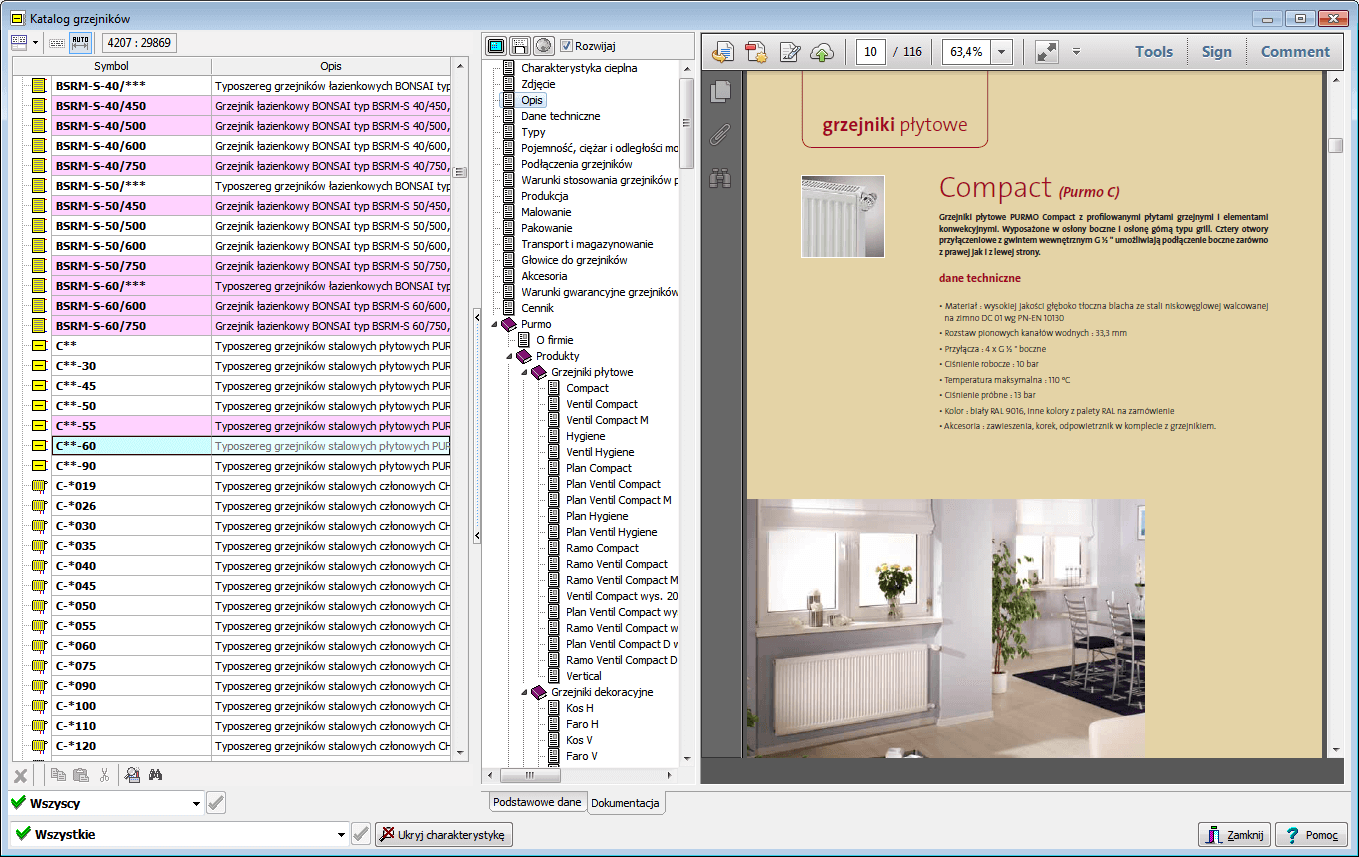
| Catalog photos of selected devices in the hints in the table |
|
|
|
|
|
|
|
|
|
|
| The function of organizing zones of risers on the diagrams |
|
|
|
|
|
|
||||
| Considering the heat gains from connections to underfloor radiators as a radiator power |
|
|
|
|
|
|
|
|
|
|
| Selection of pipe diameters in the installation |
|
|
|
|
|
|
|
|
|
|
| Selecting radiators (catalog 55 thousand) |
|
|
|
|
|
|
|
|
|
|
| Selecting fittings |
|
|
|
|
|
|
|
|
|
|
| Provides total pressure losses in the system |
|
|
|
|
|
|
|
|
|
|
| Reduces excess of pressure in the circuits through the selection of presets on the valves or flanges selection of the throttle bores. |
|
|
|
|
|
|
|
|
|
|
| Adjusts presets of the pressure and flow rate governors |
|
|
|
|
|
|
|
|
|
|
| Takes into account the requirements regarding the authorities of thermostatic valves |
|
|
|
|
|
|
|
|
|
|
| Selects group of pumps |
|
|
|
|
|
|
|
|
|
|
| Selects pumps |
|
|
|
|
|
|
|
|
|
|
| Allows the use of dual manifolds |
|
|
|
|
|
|
|
|
|
|
New program features
- Possibility to import building bases from Autodesk® Revit® via a gbXML file,
- Possibility to export data about the designed installation to Autodesk® Revit®..
New program features Audytor
- Import and export of drawings in DWG format
- The function of organizing the zones of risers in the development
- Data file backup system
- A mechanism that automatically generates an axonometric scheme of the designed installation
- Ability to display installation pipes with actual diameters
- Mechanism of intelligent duplication of installation elements
- The function of arranging labels on several storeys at the same time (in plan views and axonometry drawings) and a mechanism for duplicating labels on adjacent storeys
- Improving the drawing of sewage installations.
- A system of keyboard shortcuts to assign simple button combinations to the most used drawing tools.
- Improvements in editing drawing layer properties.
- Improvements in displaying information about the circulation by a given heater / receiver.
Rakenduse omadused
Rakendus võimaldab teostada süsteemi täielikud hüdraulilised arvutused, muuhulgas see:
-
valib torude läbimõõdud;
-
määratleb erinevate torustike hüdraulilise vastusurve, arvestades seejuures torudes ja soojusvahetitest leiduvast jahutusveest tuleneva gravitatsioonisurvega;
-
määratleb kogu süsteemi survekao;
-
vähendab ringlussüsteemi ülemäärast survet reguleerides juhtklappe või muutes drosseldusavade läbimõõte; arvestab vajadusega tagada piisav hüdrauliline vastusurve torustikus;
-
reguleerib süsteemi projekteerija poolt valitud punktidesse (püstikule süsteemi harule jm) paigaldatud surveregulaatoreid;
-
arvestab termostaatilistele klappidele kehtivate nõuetega (süsteemile sobivad survelangused);
-
valib sõlmpunkti (versioon 3.8);
-
valib sõlmpunktiga toimivad puhverseadmed (versioon 3.8);
-
valib pumbagrupi;
-
valib pumbad;
-
võimaldab kasutada hüdraulilisi leevendeid;
-
võimaldab kasutada topeltkollektoreid.
Rakendus võimaldab teostada süsteemi täielikud soojusarvutused, muuhulgas see:
-
määratleb torude küttevõimsuse;
-
arvutab kütteaine jahtumiskiiruse torudes;
-
määratleb kindlaks küttekoormuseks vajaliku radiaatorite suuruse;
-
valib sobiva kütteaine voolumahu, arvestades aine jahtumisega torudes ja küttevõimsusega (sobib ka olemasolevate süsteemi reguleerimiseks, nt soojustatud hoonetes);
-
arvestab vee jahtumisega gravitatsioonilise rõhu toimel ning kütteseadmete soojusväljundiga;
-
arvutab projekteeritud põrandaküttesüsteemi parameetrid.
Rakenduses on võimalik projekteerida järgmisi süsteeme:
-
pumbasüsteemid;
-
torustikud: ühe, kahe, nelja toruga või segatüüpi;
-
kütte- või jahutusaine: vesi, etüleenglükool või propüleenglükool;
-
ülemised ja alumised jaotussüsteemid, horisontaalsüsteemid, kollektorsüsteemid;
-
konvektsioon-, põranda-, seinaradiaatorid;
-
automaatsed õhutusklapid (süsteemil ei saa olla võrgupõhist õhutust);
-
termostaatilised või käsijuhtimisega radiaatoriventiilid;
-
süsteemi esmane tasakaalustamine eelseadistatud ventiilide või äärikute abil;
-
diferentsiaalsurve stabiliseerimine vastavate regulaatorite abil;
-
vooluregulaatorite kasutamise võimalus.
Andmebaas sisaldab teavet torude, ventiilide ja küttekehade kohta. Ühes projektis saab samaaegselt kasutada erinevate tootjate liitmikke, torusid ja radiaatoreid. Rakendus võimaldab projekteerida väga suuri süsteeme (kuni 140 püstakut ja 12000 radiaatorit).
Tarkvaraga kaasneb ka joonise standardosade (plokkide) andmebaas, mis sisaldab tüüposasid nagu vertikaal- või kollektorsüsteemid, ning võimaldab kiiresti luua süsteemi jooniseid. Lisaks on kasutajal võimalus määratleda piiramatu arv kohandatud plokke, mis võivad koosneda mis tahes joonise osast. Selliseid plokke on edaspidi võimalik kasutada ka teistes projektides. Dubleerimisfunktsiooni abil on võimalik ühe korruse joonist kopeerida automaatselt ka järgnevatele korrustele (joonis 2).
Andmete sisestamine
Rakendusse saab andmeid sisestada plaanidel graafilise liidese kaudu või diagrammidel. Joonestatud elemente puudutav teave esitatakse plaanivaadetega seotud tabelites või diagrammidel. Tänu tabelipõhisele süsteemile on võimalik kiiresti muuta nii üksikute torude, radiaatorite ja liitmikega seotud andmeid, kui ka terveid komponentide gruppe. Iga süsteemi kuuluv komponent on varustatud valideerimis- ja tugisüsteemiga, mis kogub teavet sisestatavate koguste ja vastavate kataloogiandmete kohta.
Andmesisestuse lihtsustamiseks on tarkvaral:
-
võimalus redigeerida samaaegselt mitut süsteemi komponenti;
-
võimalus kasutada valmis plokke;
-
nutikad funktsioonid, mis kopeerivad joonise detaile horisontaalselt ja vertikaalselt ning nummerdavad elemente vastavalt ümber;
-
võimalus määratleda piiramatu arv kohandatud plokke, mis võivad koosneda mis tahes joonise osast;
-
kiire ligipääs täiendavale teabele sisestavate koguste kohta;
-
ekraaninupud, mis võimaldavad kiiret ligipääsu sagedamini kasutatavatele komponentidele;
-
funktsioonid, mis seovad dünaamiliselt jooniseid tabelitesse kantud andmetega;
-
funktsioonid, mis ühendavad automaatselt torudega liitmikke, radiaatoreid ja teisi süsteemi komponente;
-
automaatne püstikute loomine plaanivaadete alusel;
-
võimalus muuta andmeid tabelivormis, et määratleda mitme valitud komponendi andmeid samaaegselt;
-
joonise ja tabeli vahelised seosed tõstetakse joonisel esile komponendi valimisel tabelist.
Andmete diagnostikasüsteem
Iga süsteemi kuuluv komponent on varustatud valideerimis- ja tugisüsteemiga, mis kogub teavet sisestatavate koguste ja vastavate kataloogiandmete kohta ning kontrollib jooksvalt andmete õigsust.
Ehitise alusjoonised
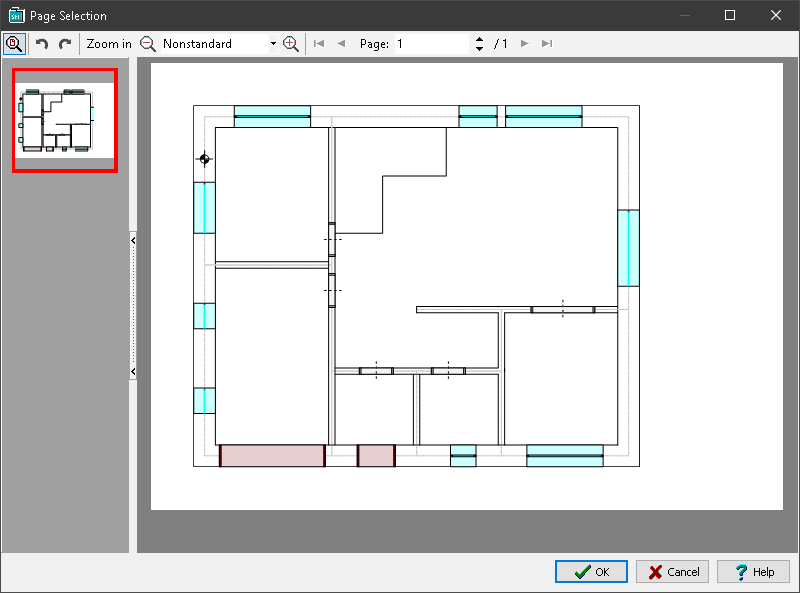
See rakendus võimaldab luua süsteemi projekti täismahus graafilise dokumentatsiooni tänu võimalusele kuvada arvutustulemusi korruseplaanidel. Sageli tuleb projekteerimise käigus sisestada projekti kujutis. Kujutisi on võimalik sisestada avades faile, skaneerides või kleepides mujalt. Sisestamise järel vajavad kujutised sageli joondamist, kalibreerimist, vähendamist või täiendavat korrigeerimist.
Tehnilisi jooniseid (nt alusjooniseid) luuakse tänapäeval valdavalt arvutite abil. Need on seejärel saadaval elektroonilises vormingus failidena. Tehnilistele joonistele on sobivaimad vektorvormingud (nt DWG, DXF, WMF, EMF). Pildifaile on võimalik luua ka skaneeringutena. Sel juhul luuakse need pea alati rastervormingus (BMP, JPG, JPEG, TIF, TIFF, GIF, ICO, PNG).
Üldjuhul tuleb pildi laadimisel sisestada andmeid dialoogiaknasse Picture (kujutis). Kui kujutis on rakendusse sisestatud, siis vajab see reeglina joondamist ja vähendamist. Hea elektroonilise tulemuse saavutamiseks võib kujutis vajada ka kalibreerimist. Rakenduses on võimalik valida skaneeringu resolutsioon ja kvaliteet ning salvestada skaneeritud dokumendid valitud graafilises vormingus. Rakendus ühildub TWAIN-standardil põhinevate printeritega.
Bonding and scaling drawings
HL programs and CH are equipped with the function of Graphic creation of a building model. This function gives you the opportunity to draw a building model. To simplify the action of drawing, you can load a drawing base into the program. The file being loaded can come from an external program for creating technical drawings (eg DWG), or from a scanned drawing (eg JPG). The scanned drawing can be divided into several files. Drawings scanned into several files usually do not keep the scale precisely enough. They can also be rotated relative to each other by a small number of degrees.
Drawing bonding allows you to quickly scale multiple scanned drawings (in different sizes and rotated) and bond them with one another.
Graafiline redaktor
Süsteemi projekteerimiseks on vaja tähistatud ruumidega joonist. Projekteerija saab joonistada ruume käsitsi või laadida neid koos plaanivaadetega küttekoormuse rakendusest (OZC 6.5). Kui hoone kolmemõõtmeline mudel loodi rakenduses OZC 6.5, siis saab plaanivaateid koos küttearvutustega importida rakendusse CH. Tabelivormis sisestatud hooned laetakse ruumide ja vastavate arvutustulemuste loendina.
Kõige mugavam viis rakenduste OZC 6.5 ja CH 4.0 kombineeritud kasutamiseks:
-
hooneplaanide importimine DWG, DXF, WMF jt vormingutes failidena rakendusse OZC 6.5;
-
hoone 3D-mudeli loomine rakenduses OZC 6.5 ning soojusarvutuste teostamine;
-
tulemuste laadimine rakendusest OZC 6.5 rakendusse CH 4.0 (küttekoormus ja põrandaplaanid);
-
süsteemi projekteerimine rakenduses OZC 6.5 ja arvutuste läbiviimine.
Süsteemi on võimalik projekteerida kas diagrammivaates, plaanivaates või mõlemat kasutades.
Süsteemi koostamisel plaanivaadetes, loob rakendus automaatselt lihtsa diagrammi, mis "ühendab" plaanivaated.

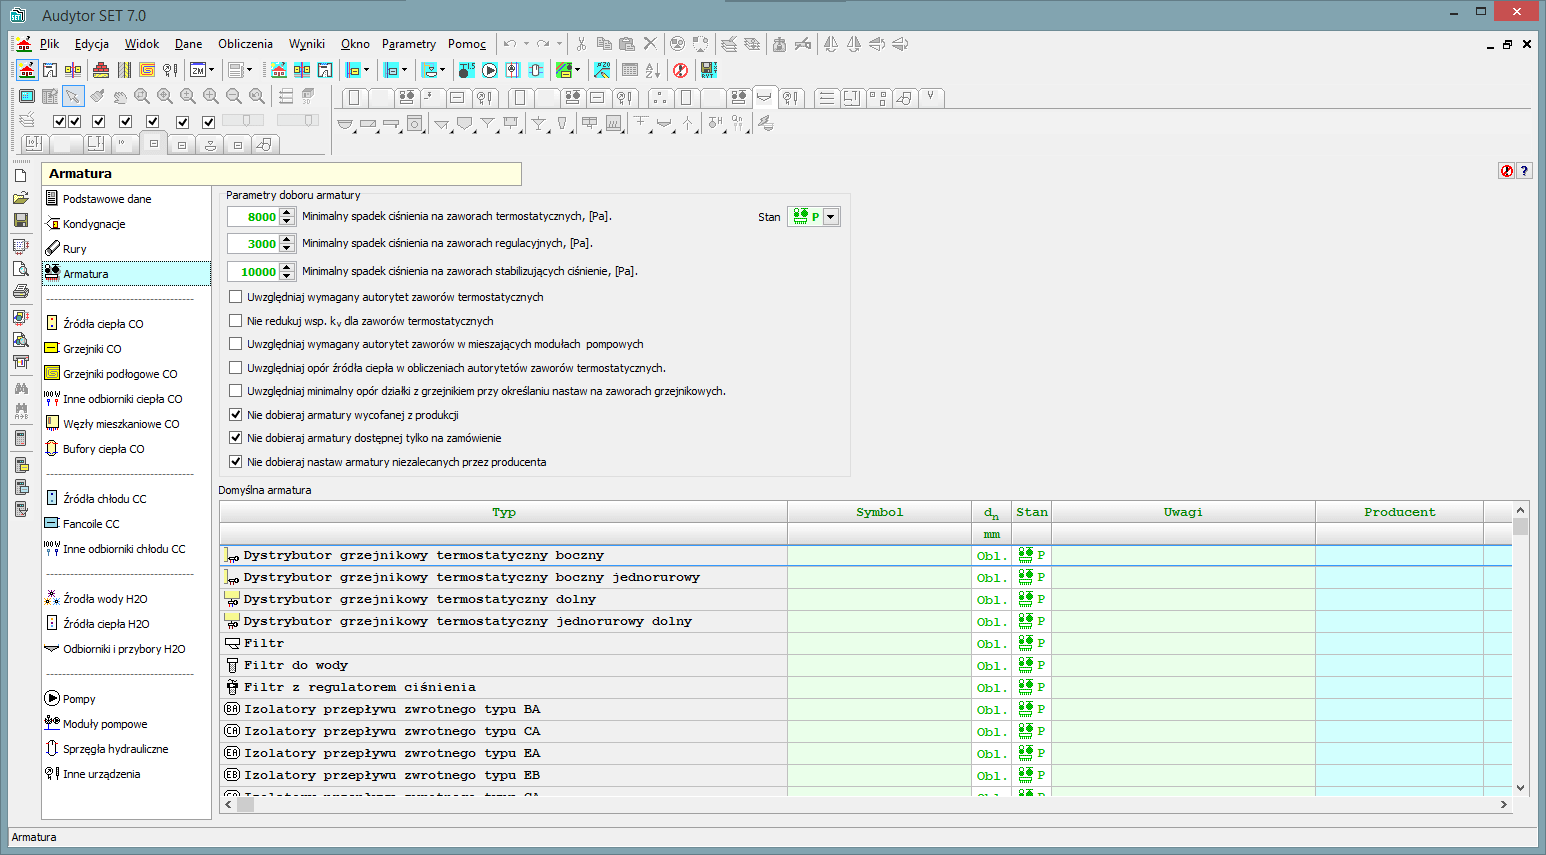
Vaikeandmete rakendamise süsteem
Märkimisväärne osa hoone alustamise käigus sisestatavatest andmetest kehtib ka ülejäänud hoonele (nn vaikeandmed). Neid andmeid kasutab vaikeandmete rakendmise süsteem.
Kasutaja saab igale seadmeklassile määrata muuhulgas ka vaikimisi kataloogisümboli. See sümbol rakendatakse automaatselt kõigile projektis kasutatavale seadmele. Kataloogi vaikesümbolit on võimalik alati muuta, ka pärast seadmete lisamist joonisele. Sümboli muutmine üldandmetes muudab kõigi seda tüüpi seadmete sümboleid, kui üksikule komponendile ei ole eraldi määratud kindlat sümbolit. Ka mitmeid muid parameetreid on võimalik rakendada üldtasandil.
Andmeid muudetakse tabelis, mis võimaldab samaaegselt määratleda mitme elemendi parameetreid. Joonise ja tabeli vahelised seosed tõstetakse joonisel esile komponendi valimisel tabelist.
Vaikeandmete rakendamise süsteem võimaldab teil:
-
säästa märkimisväärselt aega andmete sisestamise etapis (kaotab vajaduse sisestada andmeid korduvalt);
-
kiirelt muuta korduvaid andmeid, kui projekt muutub või peate looma projektist mitmeid variante.
Working in a shared environment Audytor SET
The program (since version 7.0) has been created as a module of the Audytor SET program and enables the simultaneous design of cooling, cold and hot water systems together with circulation and central heating installations. Individual modules of the program cooperate with each other and use a common 2D and 3D graphic environment.
Backup system of data files
The program has a mechanism that automatically creates a set of project backups (up to 8 files).
Data files are backed up every time data is saved, with the new files overwriting the older files so that at least one copy of the file from each stage of the project work is always kept.
This function will allow you to recover the project file even if its last versions are overwritten or damaged.

Extensive directory database
The program catalog database contains information on pipes, fittings and radiators. This database is constantly developed.
In one design, fittings, pipes and radiators from different companies can be used simultaneously.
Projekteerimise tugifunktsioonid
-
Hiirekursor muutub väikseks pildiks kõige sobivamast või viimatikasutatud funktsioonist.
-
Kuvatakse lisaliinid, mis võimaldavad automaatset ühendamist kindlate liitepunktidega (nt radiaatorite liitekohad).
-
Torusid on võimalik joonestada paaridena (varustus-/tagastusahel), millel on määratud vahed ja mis, vajadusel, ühendatakse automaatselt seadmetega (nt radiaatorite liitpunktidega).
-
Torustike joonestamine polügoonse ahelana vähendab vajalike hiireklikkide arvu.
-
Radiaatorite automaatne sisestamine akende alla.
-
Radiaatorite automaatne ühendamine torudega.
-
Võimalus kopeerida mis tahes joonise osa ühe korruse piires või järgmisel korrusel.
-
Võimalus luua elementidest peegelkujutisi.
-
Võimalus kasutada valmis plokke. Tarkvaraga kaasneb ka joonise standardosade (plokkide) andmebaas, mis sisaldab tüüposasid nagu püstakud, korteri- või kollektorsüsteemid, ning võimaldab kiiresti luua süsteemi jooniseid.
-
Võimalus määratleda piiramatu arv kohandatud plokke, mis võivad koosneda mis tahes joonise osast. Eelmääratletud plokke on edaspidi võimalik kasutada ka teistes projektides.

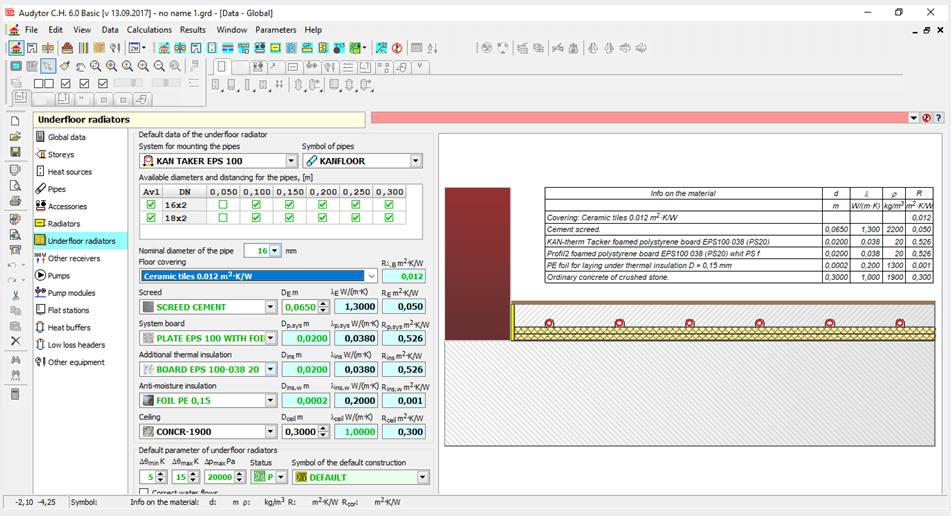
Põranaküttesüsteemide projekteerimine
Sel rakendusel on integreeritud põrandaküttesüsteemide projekteerimise moodul. See on keskküttesüsteemide projekteerimise graafilise süsteemi keskne osa. Põrandaaluse küttesüsteemi projekteerimise esimene samm on määratleda põranda ehitus (joonis 3). Rakenduse andmebaasis on kõige populaarsemad põrandaküttesüsteemid, sh torud, süsteemiplaadid, soojus- ja niiskustõkked, kinnituselemendid jm. Projekteerija võib luua terve struktuuride komplekti, mis on saadaval ka järgmistes projektides. Rakendus teostab arvutusi vastavalt standardile EN 1264. Põrandaküttesüsteem projekteeritakse valitud süsteem, märg- või kuivlahenduse ning põranda struktuuri alusel. Valitud soojustusmaterjali tootjapoolsed andmed on vaikeseadistuses, kuid neid saab soovi korral kohandada.
Põrandaküttelahenduse kütteväljundi esialgsed arvutused saab teostada vahetult pärast põranda struktuuri sisestamist (joonis 4). See võimaldab ligikaudselt hinnata radiaatori soojusväljundit, põranda pinnatemperatuuri ja teisi parameetreid. Arvutustulemused võivad osutuda kasulikuks radiaatorite valimisel kindlatesse tubadesse.
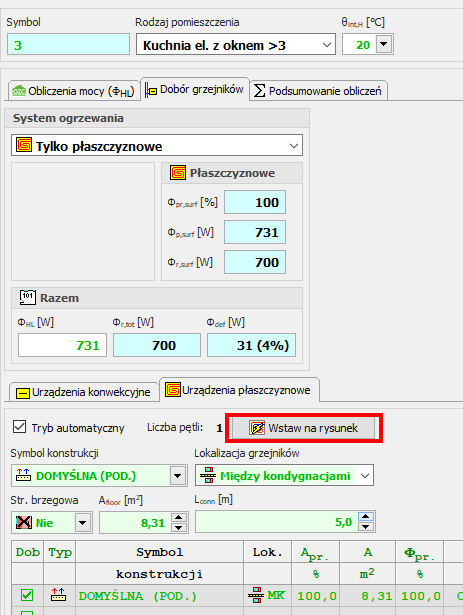
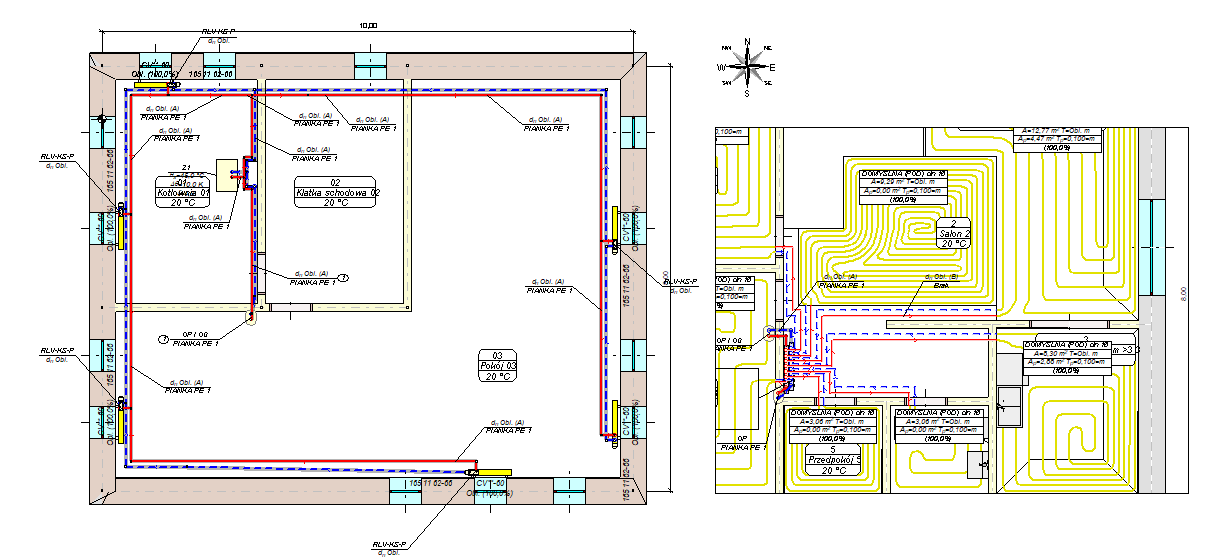
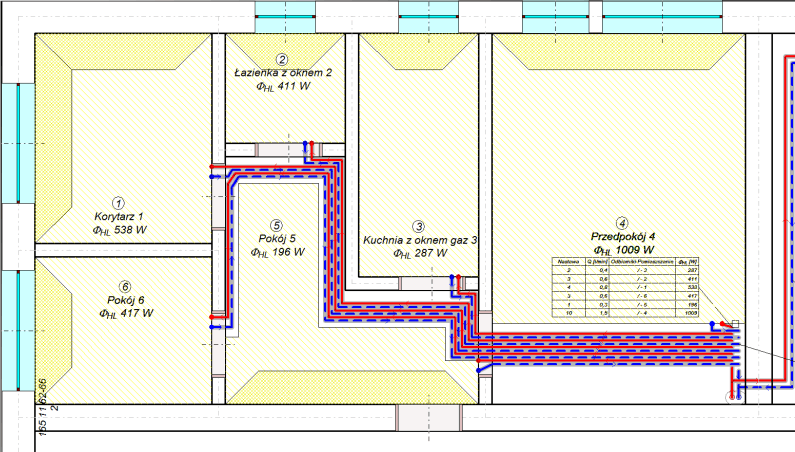
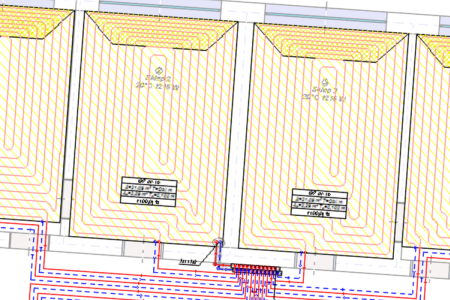
Põrandaküttesüsteemi lisamiseks joonisele piisab, kui sisestada andmed selle tüübi kohta, selle osakaal ruumi küttemahust ning radiaatorile ettenähtud põrandaala (joonis 5). Rakendus valib arvutamise käigus kütteahela torude sobiva paigutuse, arvutab tegeliku pindala ning ahela pikkuse.
Automatic drawing of the underfloor heating coil
The program is equipped with the function of automatic drawing of a heating pipe routing scheme in a spiral system.
Coils are created in all floor heaters on floor plans, taking into account the spacing of supply and return pipes as well as the indicated spacing between the pipes wherever possible, both in the basic zone and in edge zones.
The program also performs precise calculations of the generated coil length.
Andmete kontroll ja arvutustulemused
Programm kontrollib andmete sisestamisel pidevalt nende õigsust. See vähendab märkimisväärselt võimalike vigade hulka. Arvutusprotsessi käigus toimub täielik andmete valideerimine. Seejärel luuakse vigade, hoiatuste ja nõuannete nimekiri. Selles nimekirjas on välja toodud teave tähtsusastme ja probleemi asukoha kohta.
Arvutuste teostamise järel analüüsib programm saadud tulemusi. Luuakse teadete analoognimekiri. Põhjalik süsteemi diagnostika võimaldab projekteerijal hinnata koostatud projekti kvaliteeti. Rakendus on varustatud veakoha kiirotsinguga (leiab automaatselt tabeli, rea ja veeru, milles on valed andmed, või viitab vigasele komponendile joonisel).
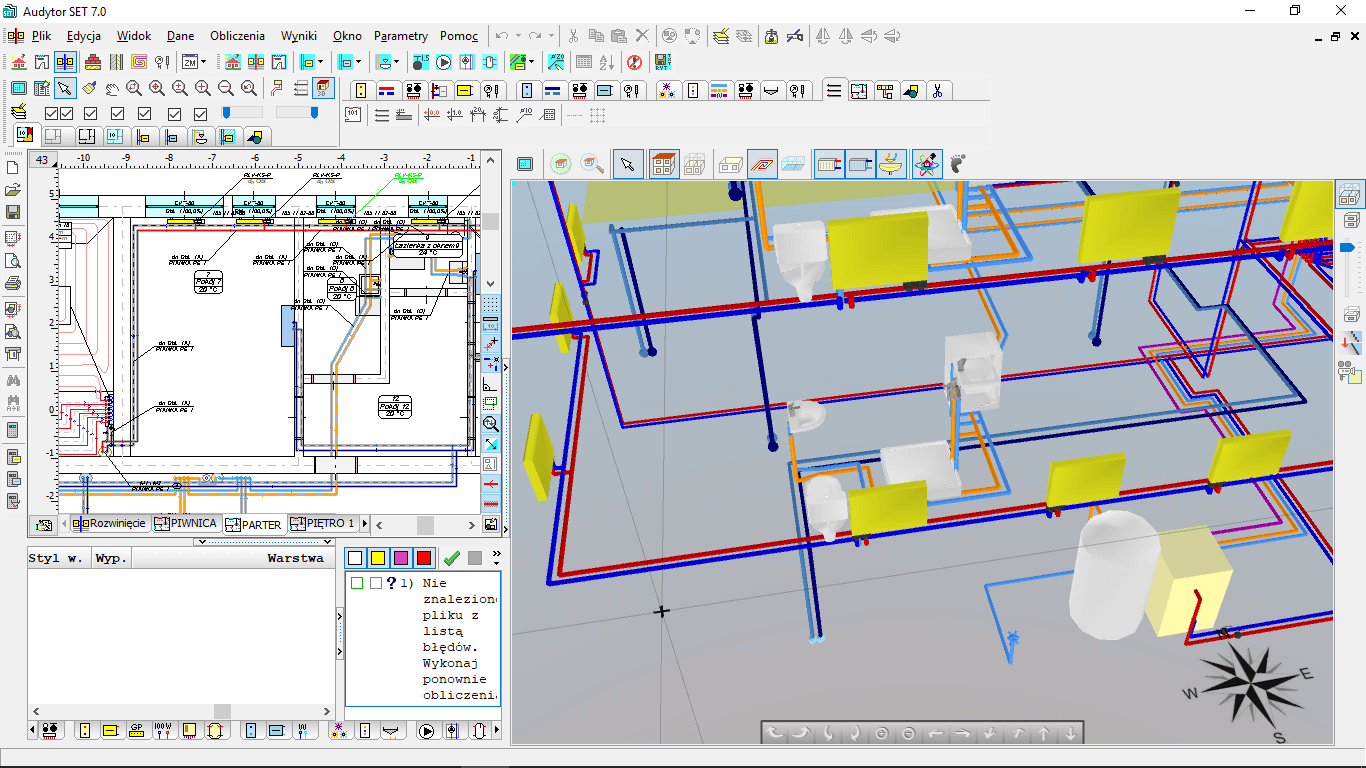
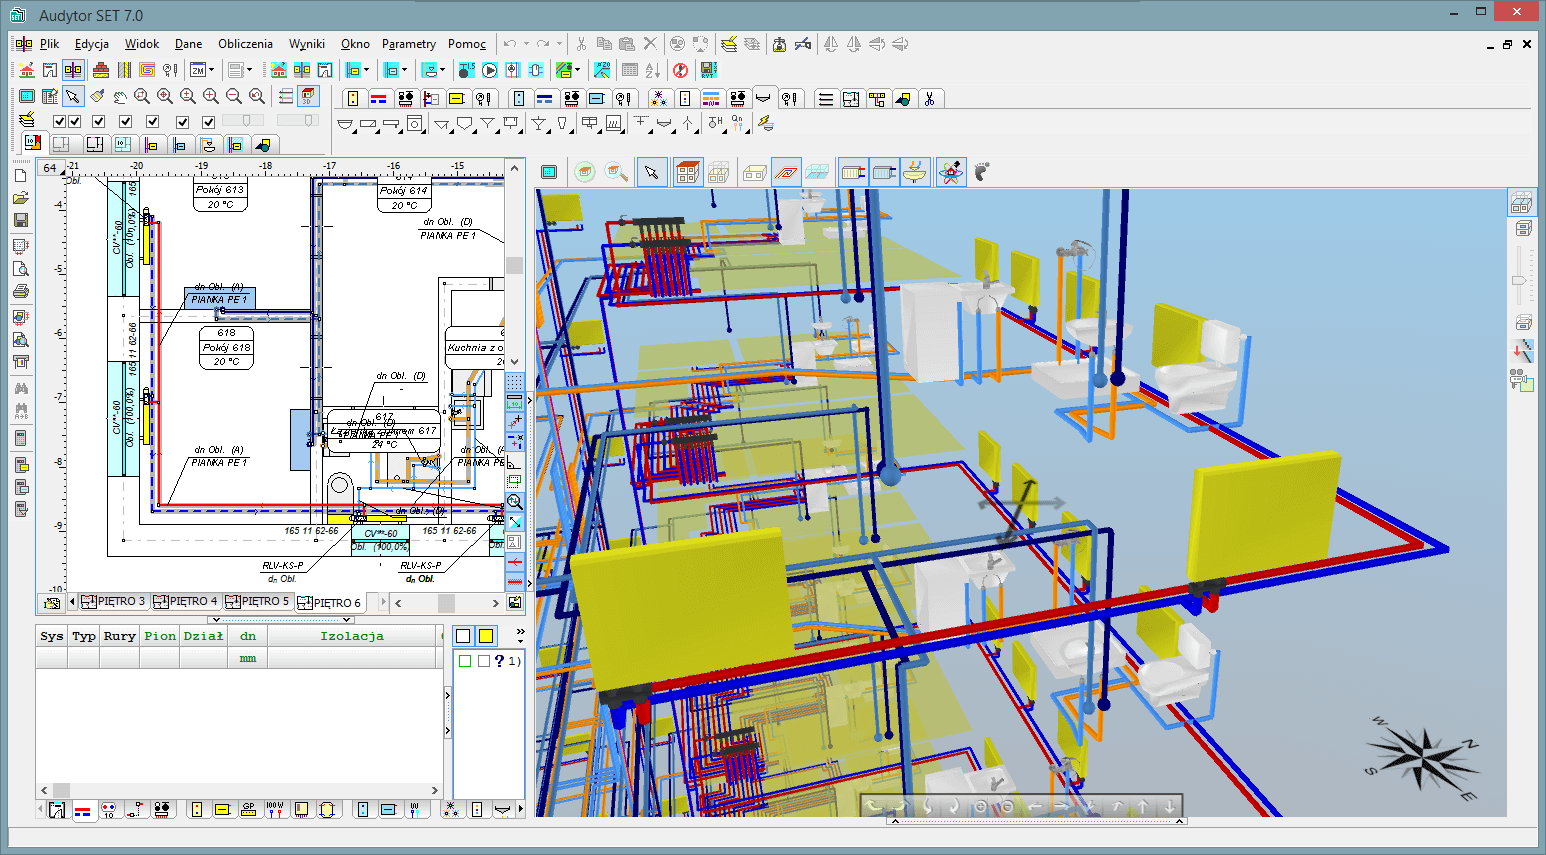
Three-dimensional visualization of the installation
The function allows you to export the installation project to a file that can later be loaded into Autodesk® Revit® using the Audytor SET plugin for Revit.
The function allows you to export from the data and export from the results. Export from data allows you to save even an incomplete installation project (not recalculating), for example, the arrangement of the water risers, or the layout of the radiators. Export from results allows us to use technical data of selected pipes and devices in Autodesk® Revit®, eg pipe diameters, valve settings, radiator sizes, and pipe spacing in underfloor heating. In addition, physical quantities are available, such as the medium speed, the power of the radiator, and pressure losses.
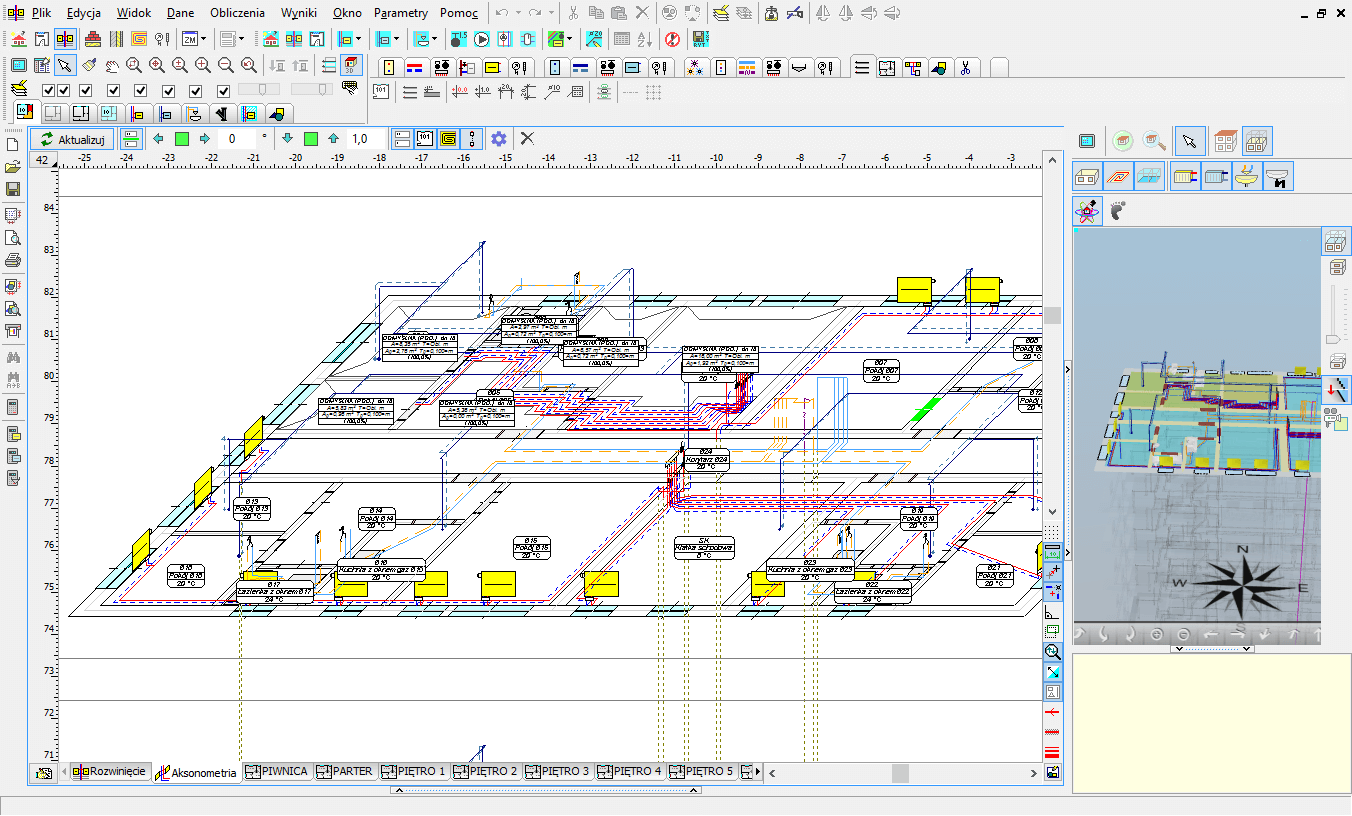
Automatic axonometry of the installation
The program since version 7.1 has a mechanism that automatically generates the axonometric scheme of the designed installation.
Axonometry drawing can be printed or exported to DWG format, which allows to create a complete project documentation.
The axonometry schema also allows displaying the scheme of the entire installation in one drawing allowing for a more precise orientation in the project and selecting and simultaneously editing the element data on different floors, which significantly speeds up the procedure of design modification and installation adjustment.
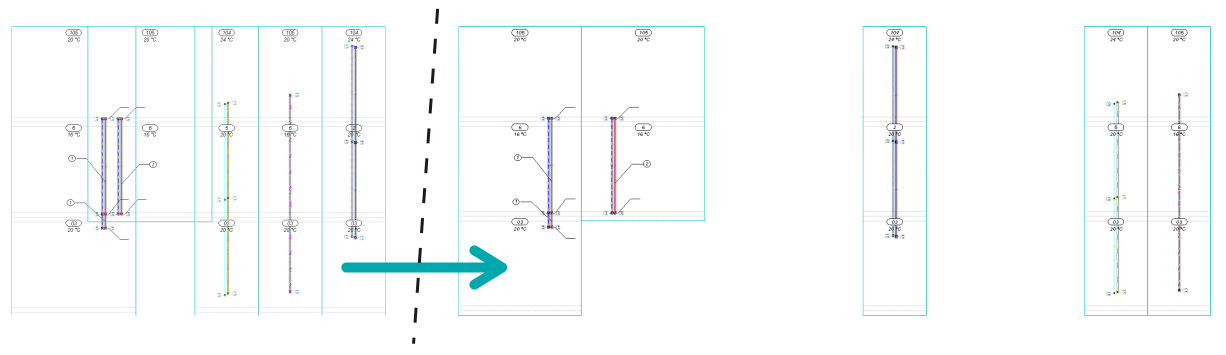
The function of organizing zones of risers on the diagrams
In the drawing of the automatically created installation diagrams, the Organize button that has been added, enables the intelligent positioning of the zones of risers based on the data from the storey's plan views.
The program maintains the order of the risers within individual installation systems (CH, CC and H2O).
The function is particularly useful for large projects, significantly reducing the time needed to manually move the risers' zones.
The parameters of the organizing function can be modified.
Andmete kontroll ja arvutustulemused
Andmete sisestamisel kontrollib programm automaatselt nende õigsust. Rakendus salvestab veateate ja tuvastatud vigadega seotud teabe veafailis. Vigade loendi aken on varustatud vigade lokaliseerimise funktsiooniga. Rakendus tõstab esile joonise osad ja tabelis leiduvad andmed, et tähistada elemente, mille puhul tekkis viga.
Veadiagnostika võimaldab projekteerijal hinnata projekti kvaliteeti. Rakendusel on kiire otsingumehhanism, mis viitab vea asukohale (leiab vigaste andmetega tabelid, read ja veerud ning tuvastab sobimatud komponendid paigaldise joonisel).
Arvutustulemused
Arvutustulemusi on võimalik esitada nii graafilisel kui tabelikujul (joonis 7). Üksikuid süsteemi komponentide silte on võimalik vabalt muuta (valida kuvatavad väärtused ja siltide kujundus).
Kõigi tabelite vormingut on võimalik kohandada (valides kuvatavad read ja veerud, muutes kirjastiili) ja sorteerida vastavalt vabaltvalitud filtrile.
Tabelid sisaldavad üld- ja üksikasjalikke tulemusi spetsiifiliste seadmete ja ahelate kohta ning materjalide ja liitmike nimekirju.
Arvutustulemustega joonistel on valitud seadmega seotud andmetega sildid. Siltide vorming on täielikult kohandatav. Sildile saab kanda kõiki valitud elemendile kehtivaid tulemusi. Silte saab salvestada mitmes vormingus ja igal ajal uuesti muutmiseks avada.
Arvutustulemusi on võimalik välja trükkida plotteri või printeriga. Kasutaja saab valida joonise suuruse ja kasutada trükkimise eelvaadet, et otsustada, kuidas joonised trükitakse.
Kui joonis ei mahu ühele paberilehele, siis trükib rakendus selle osadena, mille saab omavahel kokku kleepida. Tänu sellele funktsioonile on võimalik ka kõige tavalisema A4 printeriga trükkida suuri jooniseid. Rakendus saab salvestada jooniseid ka DXF- ja DWG-vormingus failidena. Salvestatud jooniseid on võimalik avada ka muus tarkvaras, nt AutoCAD-is.
Arvutustulemuste tabeleid on võimalik välja trükkida ja avada teistes Windows-keskkonnas töötavates rakendustes (nt Excelis, Wordis jt).
Designing a several installations in one project
The ability to design several systems in one project in order to design the entire system for the building at the same time.

Efficient and fast calculation process
Program is equipped with a highly efficient analysis algorithm of graph installations and efficient algorithms of selection of pipes, fittings and accessories, which allow to calculate large installations in in less than a few seconds.
Creating technical documentation
Designers can use the editor of labels, creating overview of materials and components of heating systems in order to prepare technical documentation of projects. Diagrams of heating systems can be divided into any number of drawings. Drawings themselves can be exported into the DWG format.
Technical requirements
The program runs under MS Windows (10, 11) 32bit and 64 bit.
The minimum hardware:
- 1200 MHz processor,
- 4 GB RAM,
- 2 GB of free hard disk space,
- A color monitor with a minimum screen resolution of 1024x768,
- 500 MB free space on the hard drive,
- Compatible graphics card with OpenGL 2.0 and higher: all new graphics cards on the market should meet the minimum hardware requirements;
Hardware requirements for the 3D editor
Vertical resolution requirements for the screen:
- minimum - 768 points,
- sufficient for comfortable work - 900 points,
- the most convenient - 1080 points.
Requirements for system font settings:
- Windows Vista, 7, 8 - fonts "100% smaller",
- Windows XP - "normal" fonts.
The computer should have a graphics card that supports OpenGL technology in the version:
- minimum 2.0,
- sufficient for comfortable work: 3.3 and higher.
Autoriõigused © 2018 SANKOM Sp. z o.o.